Technical analysis is often misunderstood as mere chart decoration or guessing games, but for professionals, it is a rigorous discipline rooted in data interpretation and market psychology. The heart of advanced technical analysis lies in the ability to extract meaningful signals from the interplay between price structure and volume flow. Together, these elements reveal the intentions and convictions of market participants, providing insights far beyond simple price trends or patterns. For professional traders, institutional analysts, and sophisticated investors, understanding how price unfolds structurally and how volume supports or contradicts these movements is essential. This article explores the core principles and advanced techniques to leverage price structure and volume flow, helping professionals decode market behaviour with greater precision and confidence.
Foundations of Price Structure
Price structure refers to the way prices organise themselves on charts over time, revealing patterns of buying and selling pressure. At the core, it is about identifying the swing highs and lows—those pivotal turning points where the market shifts direction. These swings form ranges of expansion and contraction, signalling phases such as accumulation, markup, distribution, and markdown.
Accumulation occurs when smart money quietly builds positions, usually characterised by a series of higher lows and relatively stable highs. Markup follows as the market pushes prices higher, often breaking through resistance levels with momentum. Distribution represents a topping phase where early buyers begin selling into strength, creating a subtle exhaustion in the uptrend. Markdown is the subsequent decline, often sharper and more decisive.
One key aspect of price structure is its fractal nature: patterns and swings replicate themselves across different timeframes. What looks like a small correction on a daily chart could be a major reversal on a shorter timeframe. Recognising common formations such as flags, triangles, head and shoulders, or double tops and bottoms provides a framework to anticipate potential market moves. These formations reflect shifts in supply and demand dynamics, offering clues about future price action. Find more info here.
Volume Flow as Confirmation and Divergence
Volume flow adds a critical dimension to price analysis by measuring the intensity and participation behind price moves. It’s not enough to see a price breakout; professionals look for volume to confirm whether that breakout has genuine support or if it is a weak, likely false move.
Raw volume simply counts the number of shares or contracts traded, but understanding relative volume—comparing current activity to historical averages—is where insight deepens. Volume-by-price analysis, which displays volume distribution at various price levels, can highlight significant areas of support and resistance that are otherwise invisible.
Volume often acts as a leading indicator of conviction. Spikes in volume can signal institutional interest or panic selling, while low-volume zones might indicate a lack of commitment or preparation for a reversal. Divergences between price and volume are particularly telling: if price rises but volume falls, it signals waning enthusiasm and a possible reversal; conversely, a price drop on low volume might indicate a temporary pullback rather than a sustained downtrend.
Integrating Price Structure and Volume Flow
The real power of technical analysis emerges when price structure and volume flow are analysed together. Volume can validate or invalidate breakouts and breakdowns, distinguishing genuine moves from traps. For example, a breakout through resistance accompanied by strong volume suggests that buyers are committed, increasing the probability of a sustained rally.
Conversely, if price breaches a level on low volume, it is often a false breakout or “fakeout” that can lure traders into poor entries. Professionals look for volume-led reversals, where accumulation occurs quietly under support zones, or distribution happens over resistance levels, signalling a potential shift in trend.
Combining swing structure with volume allows traders to detect footprints of institutional players. Large volume on certain swings or at key price points often hints at smart money activity, providing an edge in timing entries and exits.
Tools and Indicators for Professional Signal Extraction
Professional analysts have a toolbox of volume and structure-based indicators designed to deepen their insights. Volume Weighted Average Price (VWAP) and its anchored variants serve as benchmarks used widely by institutions to gauge average price levels over a session or longer periods. Trades near VWAP often indicate fair value, while significant moves away can highlight imbalances.
On-Balance Volume (OBV) aggregates volume flow to identify underlying buying or selling pressure over time. The Volume Profile shows the volume traded at each price level, making it easier to spot key support and resistance zones. The Accumulation/Distribution Line combines price and volume to detect whether an asset is being accumulated or distributed.
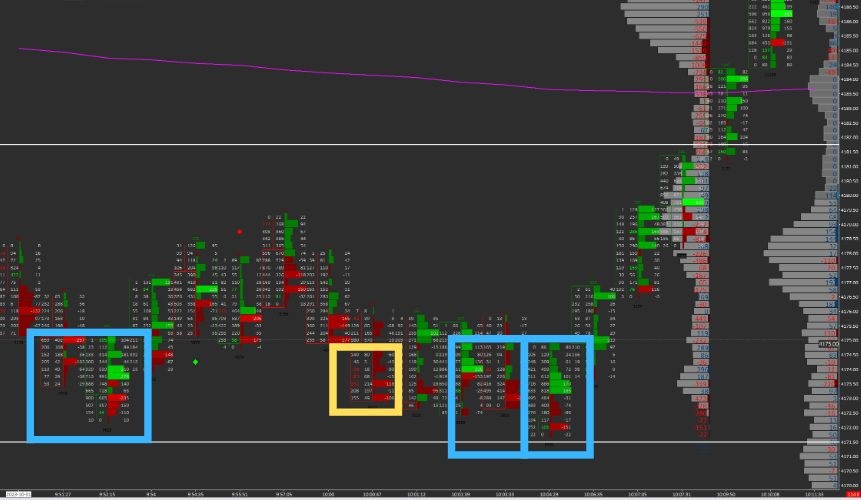
More advanced tools like Market Delta and footprint charts provide granular views of order flow and volume imbalances at the tick level. Cumulative Volume Delta tracks the difference between buying and selling volume, exposing the aggressiveness of market participants.
Conclusion
For professionals seeking to elevate their technical analysis, mastering the relationship between price structure and volume flow is essential. This dual focus enables higher-confidence signal extraction, reduces false moves, and uncovers the footprints of institutional participation. By applying discipline, contextual awareness, and continuous validation, traders can harness these insights to navigate complex markets with precision. The journey demands patience and study, but the payoff is a richer, data-driven understanding of market behaviour that goes well beyond surface-level chart reading.